Startups do not need a complex CRM setup. They need a clean sales system that helps reps follow up, keeps deal data accurate, and gives managers a pipeline they can trust.
A strong startup CRM setup should do five things from day one:
- Define pipeline stages around buyer milestones, not seller activity
- Keep contact and company data clean enough to segment, search, and report on
- Connect email and calendar so sales activity is captured automatically
- Use tasks and reminders so every active deal has a next step
- Build dashboards around pipeline health, deal movement, and realistic forecasts
The goal is not to track everything. The goal is to make your sales process visible, repeatable, and easy for reps to maintain.
Teamgate gives growing sales teams clarity, structure, and trustworthy pipeline insight without enterprise CRM bloat or feature overload. It helps reps keep deals moving with clear next steps, while giving managers the visibility they need to coach, forecast, and spot risk before deals go stale.
Key takeaways:
- Start with a CRM early to avoid messy data and lost leads.
- Define your sales pipeline around buyer milestones, not seller actions.
- Organize contacts and accounts with clean data entry and clear naming conventions.
- Automate tasks and connect tools like email and calendars to save time and ensure accuracy.
- Use dashboards to monitor pipeline health, deal movement, and realistic forecasts.
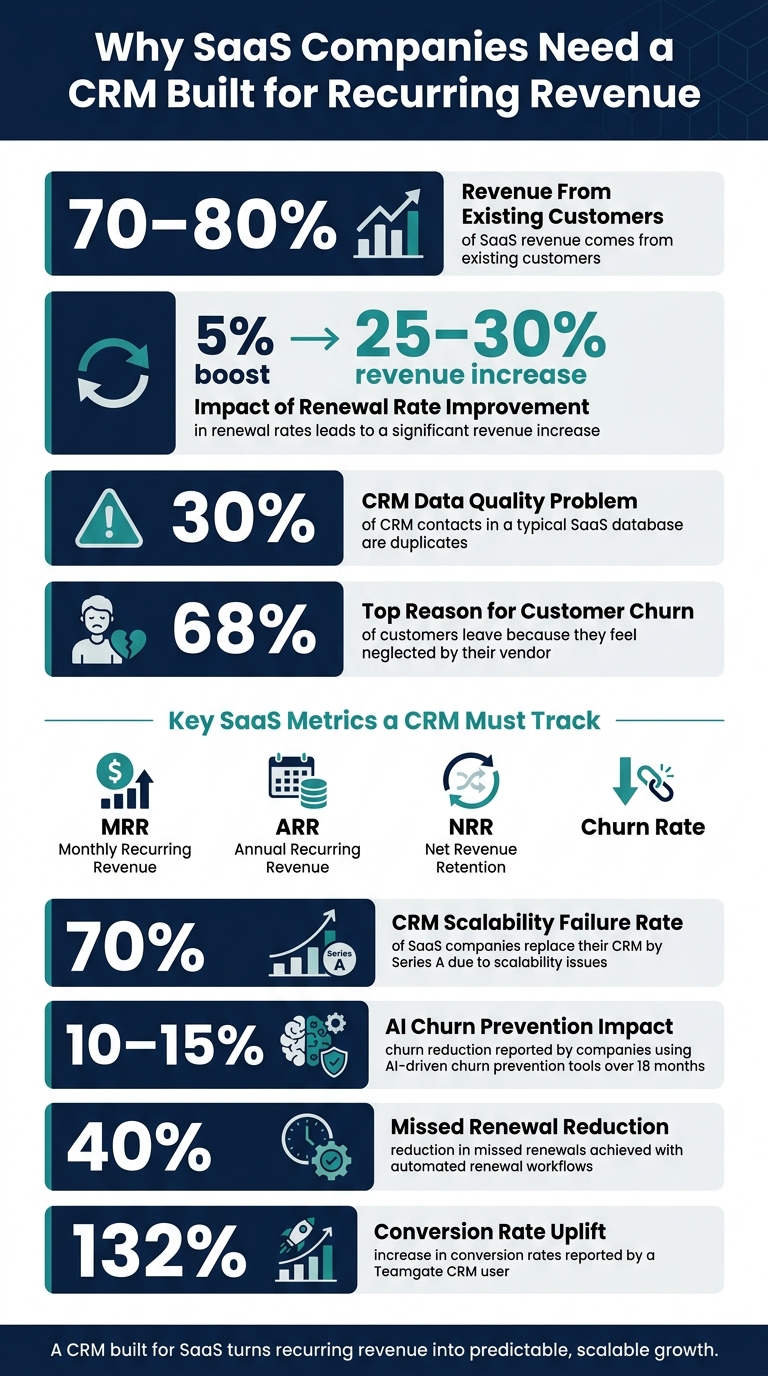
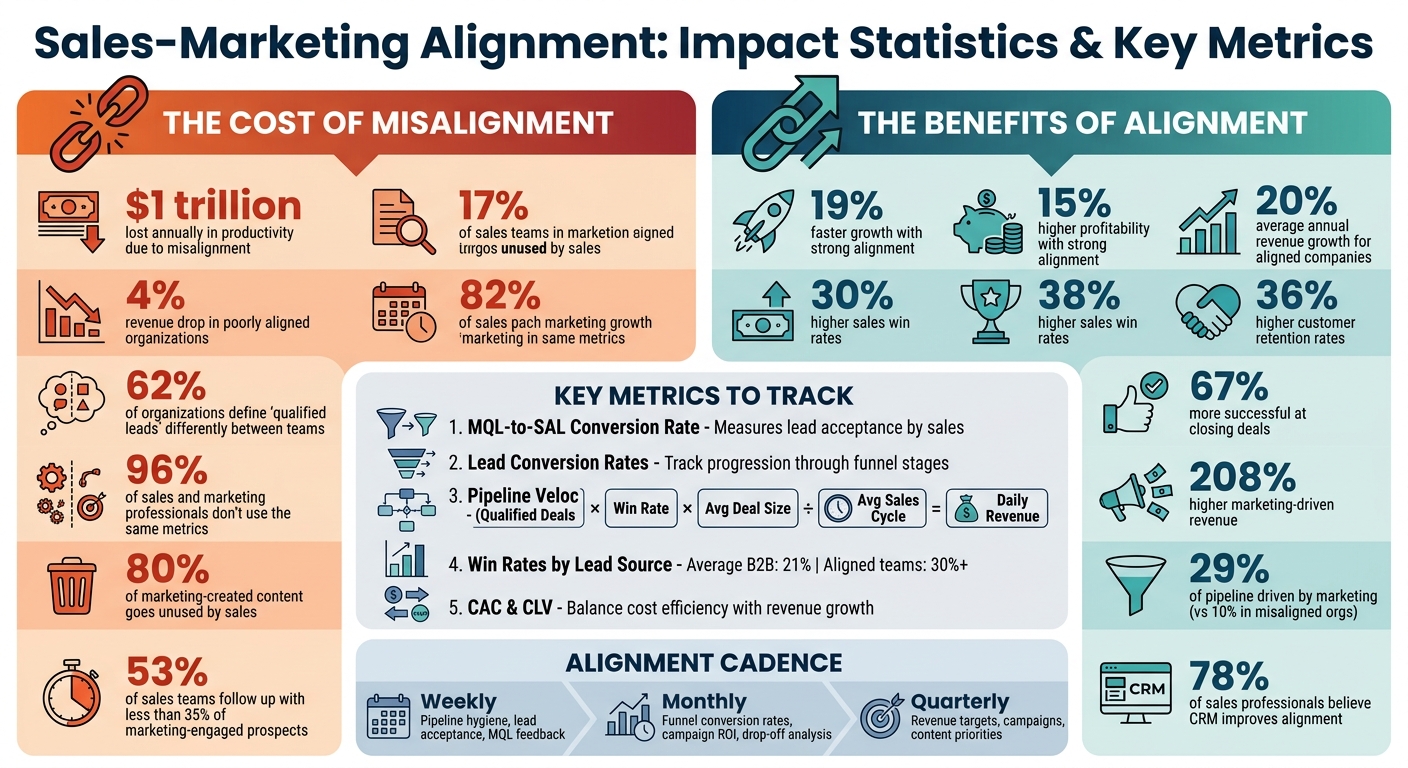
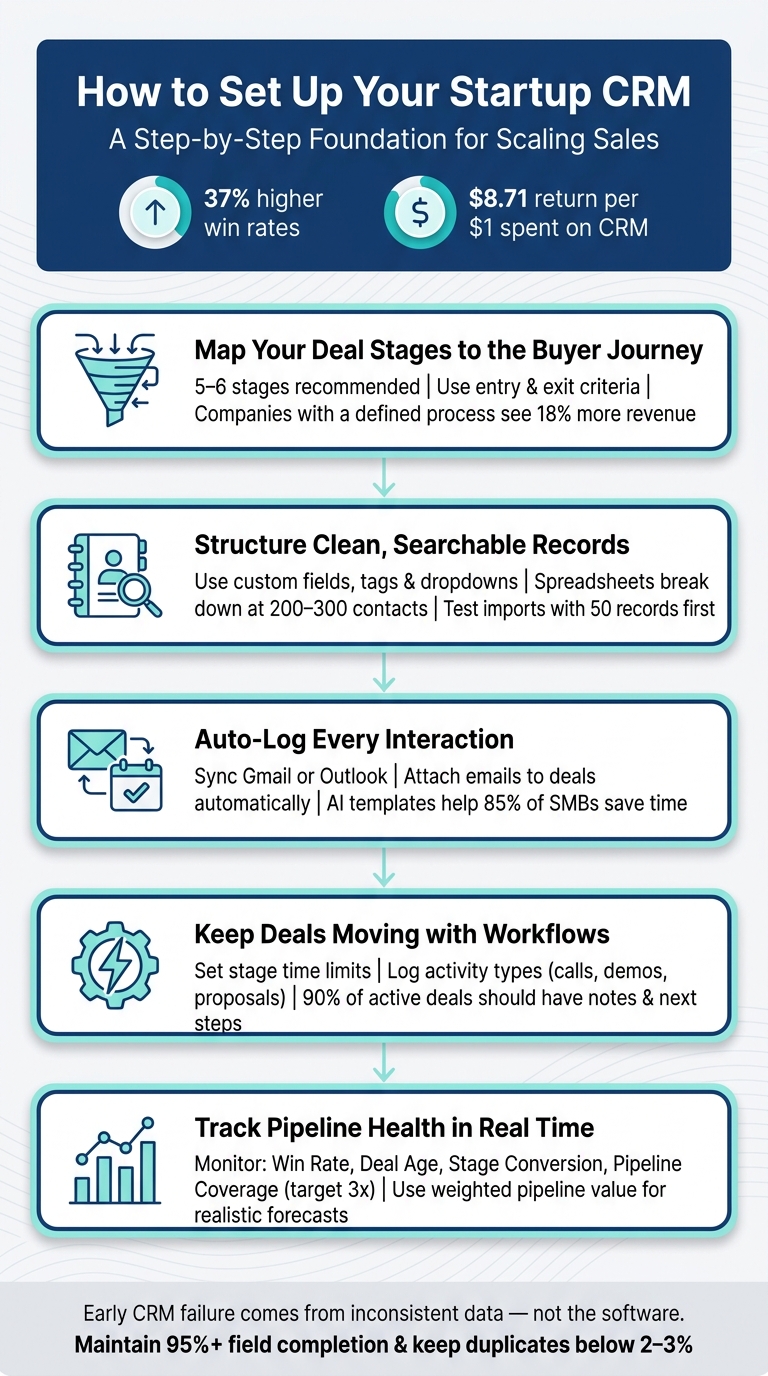
Why it matters: Startups with a CRM report a 37% increase in win rates, and every $1 spent on a CRM returns $8.71. Teamgate helps growing sales teams maintain clarity, structure, and reliable pipeline insight – without the complexity of enterprise tools.
Let’s dive into how to set up your CRM step-by-step.
How to Set Up a CRM for Startups: 5-Step Foundation Guide
How to SETUP your CRM CORRECTLY (Works for ANY CRM)
sbb-itb-5772723
Defining Your Sales Pipeline and Deal Stages
Your CRM pipeline should show where each buyer is in the decision process. It should not be a list of tasks your reps have completed.
A common startup mistake is building stages around seller actions such as “Sent Email,” “Left Voicemail,” or “Followed Up.” Those are activities. They belong in your task or activity history, not your pipeline.
Pipeline stages should answer a more important question:
What has the buyer done that proves this deal has moved forward?
That distinction matters because managers cannot forecast from activity alone. A rep may send five follow-up emails and still have no real buying progress. A useful pipeline shows evidence of momentum, such as a completed discovery call, confirmed need, proposal sent, legal review, or signed contract.
How to Map Your Sales Process into Deal Stages
Take 15 minutes to outline how leads discover your business and the key milestones they pass before they sign. This exercise typically uncovers 5 to 6 natural stages. Fewer than five stages may leave you with insufficient data, while more than seven can lead to unnecessary complexity and administrative burden.
Here’s a simple framework to get started, especially for B2B startups:
| Stage | Entry Criteria | Exit Criteria |
|---|---|---|
| Prospecting | Account matches your ICP; added to CRM | First outreach attempt sent |
| Contacted | Outreach sent | Prospect replied or agreed to a call |
| Qualified | Discovery call completed | BANT confirmed (Budget, Authority, Need, Timeline) |
| Demo / Proposal | Prospect confirmed interest | Demo delivered; formal proposal sent |
| Negotiation | Verbal intent to buy | Contract sent for signature |
| Closed Won / Lost | Contract sent | Deal marked Won or Lost with reason logged |
This structure provides a clear roadmap for your team while avoiding unnecessary steps. In fact, companies with a defined sales process report 18% higher revenue generation compared to those without one.
Setting Next-Step Requirements at Each Stage
To keep your pipeline accurate, establish clear exit criteria for each stage. For instance, a deal shouldn’t move to “Qualified” just because you had a good conversation – it should only advance once BANT (Budget, Authority, Need, Timeline) is confirmed. Similarly, a deal in “Negotiation” should only progress once a contract has been sent.
Teamgate helps reinforce this discipline with visual cues like color-coded alerts. A yellow bar highlights deals that have lingered too long in a stage, while a red bar signals overdue closing deadlines. Automated task creation further ensures that every stage change triggers a specific next action, preventing deals from going cold.
When and How to Set Up Multiple Pipelines
Once your deal stages are defined, consider whether your sales process requires separate pipelines. Start with one pipeline and add more only if distinct sales motions demand different stages.
For example, a B2B SaaS company selling to both SMBs and enterprise clients might need separate pipelines. An SMB deal might close in two weeks with just a few stages, while an enterprise deal could involve additional steps like technical evaluations, pilots, and executive approvals – taking 8 to 12 weeks. Combining these workflows in a single pipeline can skew metrics like average deal age and win rate.
Teamgate’s Team plan supports up to three customizable pipelines, while the Growth plan offers unlimited pipelines, making it easy to manage multiple workflows without disrupting your overall setup.
Organizing Contacts and Accounts for Clean Data
Getting your contacts and accounts organized is crucial for maintaining clean, reliable data. Spreadsheets tend to break down once you hit 200–300 contacts, and early disorganization can lead to expensive fixes later. Setting up your contact and company records properly from the beginning saves time, money, and frustration down the line.
How to Structure Contact and Company Records
To keep things functional, ensure every contact record includes key details: first name, last name, email, phone, job title, and company. Always link deal records to a contact so you don’t lose track of important interaction histories.
For company records, go a step further. Use custom fields to store structured, searchable data like industry, company size, or lead source. Unlike freeform notes, these fields allow you to filter and segment your data effectively. Keep tags simple and consistent – assign them to one fixed category, such as company size or type, and avoid using them for temporary statuses like “needs follow-up” to prevent clutter.
Here’s how to use common CRM features effectively:
| Feature | Use It For | Avoid Using It For |
|---|---|---|
| Lists | Relationship types (e.g., Customers, Prospects) | Process stages (“Follow-up needed”) |
| Tags | One fixed category (e.g., Company Size) | Temporary statuses (“Needs reply”) |
| Custom Fields | Filterable data (e.g., Industry, Start Date) | Storing unstructured notes |
| Pipelines | Tracking the customer journey | Categorizing company types |
Importing Existing Data Without Duplicates
When importing data, a messy source file can lead to bounce rates as high as 30–50%, which can hurt both deliverability and pipeline progress. Follow this six-step approach to ensure a clean import:
- Prepare your CSV file.
- Remove duplicates and correct typos.
- Map your columns to CRM fields.
- Test with a batch of 50 records to catch errors.
- Execute the full import.
- Audit and merge any remaining duplicates.
Testing with a small batch is critical – it prevents field mapping mistakes from affecting thousands of records. Also, set up custom fields in Teamgate before starting the import to ensure every piece of data has a proper destination.
Setting Naming Conventions and Data Entry Standards
Inconsistent data entry can cause major headaches. For instance, if one person enters “IBM” and another enters “International Business Machines”, you’ll end up with duplicate records, scattered interaction histories, and inaccurate reports. These issues can be avoided with clear naming conventions and standardized data entry practices.
Use dropdown menus (picklists) instead of free-text fields wherever possible. Dropdowns for fields like industry, company type, or deal source eliminate variations entirely. For phone numbers, standardize to the +1-XXX-XXX-XXXX format from the start. Make fields like email, role, and company type mandatory to avoid incomplete records. Assign a CRM owner to run monthly data hygiene checks and enforce CRM best practices as your team grows.
“A seller can be a future data team’s best friend if they take the time to do things right.” – Madison Schott, Amplify Partners
Connecting Email and Calendar to Track Sales Activity
After organizing your contacts and accounts, the next step is to ensure that every email, meeting, and conversation is automatically recorded – without requiring your sales reps to log them manually. By connecting your email and calendar to Teamgate CRM, all communication history is seamlessly linked to the right deals and contacts. This integration not only saves time but also ensures that every interaction is accounted for, providing a more complete and accurate sales record.
How to Connect Gmail or Outlook to Your CRM
To begin, make sure IMAP is enabled and 2-step verification is active for your email account. For secure integration, use OAuth sign-in or generate an App Password.
During the setup process, you’ll need to decide how much historical data to import – options include now, 1, 3, or 6 months. This choice is permanent, so select carefully. You can also filter which emails are synced by specifying Gmail labels or Outlook folders, such as a “Sales” folder, to prevent personal emails from being included. Additionally, configure how emails attach to deals: choose whether incoming emails link to the newest active deal, all active deals, or none, depending on your workflow when a contact has multiple open opportunities.
Syncing Your Calendar to Manage Meetings
Once your calendar is synced, events will automatically attach to the relevant contacts and deals. Similar to email, you can choose the amount of historical data to import – syncing only future meetings or including past months for immediate context on prior conversations. To maintain flexibility and privacy, you can adjust visibility settings:
- Public: Events are visible to the entire team.
- Secret: Only metadata, like the date and sender, is visible.
- Private: Events remain hidden from others.
This setup creates a unified view of sales activities, helping your team stay organized and your CRM play a central role in maintaining an efficient sales process.
Using Email Templates to Speed Up Outreach
To further streamline communication, take advantage of email templates for consistent and time-saving outreach. Start by creating 2–3 templates in your first week – such as one for initial outreach and another for follow-ups. Tools like AI-powered CRM features, which often include smart templates, have helped 85% of SMBs improve how their sales reps manage time as of 2025. Once your templates are ready, track their performance by monitoring open rates and link clicks directly in the CRM’s sales inbox. Use this data to refine your messaging and improve outreach effectiveness.
Setting Up Task and Activity Workflows for Follow-Up
Keeping your sales pipeline moving requires a solid follow-up process. By combining integrated communications with automation, you can ensure no deal lingers too long without action.
Automating Task Creation Based on Pipeline Activity
To keep deals progressing, set time limits for each stage of your pipeline. If a deal stays in a stage too long, a yellow bar appears; if the closure date is missed, it turns red. Managers can easily hover over these warnings to see how many days the deal has stalled, allowing for quick intervention.
“The experts agree that when it comes to Sales Pipeline, two stages are not enough, however, more than six stages are too many.” – Andrew Martin, Teamgate CRM
Stick to three to five pipeline stages – this strikes the right balance between simplicity and actionable timelines.
Defining Activity Types to Track Sales Work
To get a clear picture of your sales efforts, log specific activity types like Discovery Calls, Follow-up Emails, Demos, or Proposals Sent. Avoid vague notes that make it harder to spot patterns. Separate leading indicators (e.g., calls, emails) from lagging ones (e.g., closed deals) to identify potential pipeline problems early. Industry benchmarks suggest that 90% of active deals should include notes and clear next steps.
“When activity isn’t tracked, it isn’t coached. And when it isn’t coached, performance stalls. That’s how deals die in the dark.” – Vaishali Badgujar, Avoma
In Teamgate CRM, tasks logged within a deal profile automatically sync with the associated contact or company profile. This ensures that reps always have the full context as they switch between views.
Configuring Reminders and Notifications
Set up email reminders for all tasks to ensure deadlines don’t slip by unnoticed. If you delegate a task by updating the Owner field, it will show up on the new owner’s calendar and agenda, keeping everyone on track for timely follow-ups.
“Email reminders will make sure you will never forget to complete the most important tasks.” – Andrew Martin, Teamgate CRM
Setting Up Sales Dashboards for Pipeline Visibility
A startup sales dashboard should help managers answer one question quickly:
What is real in the pipeline, and what needs attention now?
A dashboard that only shows total pipeline value can create false confidence. A large pipeline is not useful if deals are old, inactive, poorly qualified, or missing next steps. The best dashboards focus on sales signals that reveal pipeline health, not just pipeline size.
Building Dashboards Around Key Sales Metrics
The best dashboards focus on the metrics that matter most. For early-stage startups, these typically include:
- Deal value by stage
- Stage conversion rates
- Rep activity counts
- Win rate
These metrics help you understand where deals stand, how efficiently they’re progressing, and whether your team is actively working the pipeline as part of a structured sales process. It’s crucial to focus on the pipeline’s actual performance rather than just top-of-funnel activity, as mixing the two can lead to confusion during reviews.
“The best pipeline isn’t the biggest one – it’s the most accurate one.” – Alex Thompson, Senior Technology Analyst
In Teamgate CRM, the sales dashboard consolidates deal value by stage, rep activity counts, and win rates into a single view, simplifying weekly pipeline reviews.
Monitoring Deal Age and Stalled Deals
Deal age tracks how long a deal has stayed in a particular stage. When a deal lingers beyond your average sales cycle, it often signals trouble. If a deal remains stuck for twice as long as the average for that stage, it’s time to either flag it for review or move it to a nurture sequence. Keeping such deals in your active pipeline inflates your numbers and distorts forecast accuracy. These stagnant opportunities – often called “ghost deals” – may look active but are unlikely to close.
By identifying and addressing these stalled deals, you can maintain a more accurate pipeline and improve revenue forecasting.
Building a Forecasting View Based on Real Data
Unadjusted pipeline values can give a false sense of security. For instance, a $50,000 deal in the “Demo Scheduled” stage might realistically be worth $15,000 if the close rate for that stage is 30%. This is where weighted pipeline value comes in – applying win probabilities for each stage to estimate realistic revenue.
A good starting point for stage probabilities might look like this:
- 30% for “Demo Scheduled”
- 60% for “Proposal Sent”
- 90% for “Contract Out”
Over time, refine these percentages based on your team’s actual win rates. The goal is to focus leadership on deals likely to close in the next 30–60 days, helping them make better decisions about resources and hiring.
“A smaller, cleaner pipeline is always more valuable than a large, optimistic one.” – Alex Thompson, Senior Technology Analyst
Key Dashboard Metrics at a Glance
The table below outlines the critical metrics for a sales dashboard and what each one indicates:
| Metric | What It Shows | Warning Signal |
|---|---|---|
| Weighted Pipeline Value | Realistic revenue forecast by stage probability | Significant gap vs. raw pipeline value |
| Stage Conversion Rate | Percentage of deals advancing to the next stage | Any stage below 50% advance rate |
| Deal Age | Days since the last stage movement | Stuck 2x+ longer than the average cycle |
| Pipeline Coverage | Total pipeline value ÷ revenue target | Below 3x coverage for B2B startups |
| Rep Activity Counts | Number of calls, emails, and meetings per rep | Low activity paired with stalled deals |
Conclusion: Building a CRM Foundation That Scales
The steps outlined above offer a clear path to setting up a CRM that grows with your business. From defining deal stages and organizing contacts to connecting tools like email and calendar, automating follow-ups, and creating sales KPI dashboards, these actions establish the groundwork for a sales process that can handle growth.
Early-stage CRM failure often stems from inconsistent data practices and unclear ownership – not the software itself. As content marketer Anna Burgess Yang aptly states:
“If your CRM feels like ‘extra work,’ the strategy is broken, not the team.”
By prioritizing disciplined data entry and assigning clear ownership from the start, your CRM can transform from a basic contact list into a powerful strategic tool. High-performing startups typically maintain field completion rates above 95% and keep duplicate records below 2–3%, ensuring accurate forecasting and a reliable pipeline.
Over time, your CRM will naturally mature. It will evolve from simple contact management to a tool with defined processes, lifecycle ownership, and integrated automation. Eventually, it becomes a key driver for forecasting and go-to-market strategies. While achieving full CRM maturity isn’t an immediate goal, laying a solid foundation and avoiding shortcuts in the early stages is crucial.
Set standards early, document your processes, and build a system that can grow alongside your team and pipeline. This approach ensures your CRM becomes a scalable asset for your startup.
FAQs
When is the right time for a startup to set up a CRM?
The ideal time for a startup to implement a CRM is right at the beginning, before growth picks up speed and managing customer interactions becomes overwhelming. Setting up a CRM early allows you to keep customer data organized, simplify sales workflows, and automate follow-ups, creating a solid base for scaling. Begin as soon as you start reaching out to customers to avoid losing potential opportunities and to give your team clear direction from day one.
What should I do if my sales process doesn’t fit a simple 5–6 stage pipeline?
If your sales process doesn’t fit neatly into a standard 5-6 stage pipeline, adjust it to mirror your buyer’s journey and the specific activities of your sales team. Keep the number of stages manageable – focus on key decision points to avoid bogging down your workflow or overcomplicating your data. Clearly define the criteria for moving deals between stages, and where possible, automate these transitions. This approach ensures your pipeline stays efficient and closely tied to your sales strategy.
How can I keep CRM data clean as my team grows?
To keep your CRM data clean as your team grows, it’s essential to set up solid data management practices from the start. Here’s how you can do it:
- Prepare and validate data imports: Before adding data, double-check for errors to avoid introducing inaccuracies.
- Standardize formats: Use consistent formats for dates, addresses, and other fields to maintain uniformity.
- Integrate tools: Connect email and calendar systems to minimize manual data entry and reduce errors.
- Conduct regular audits: Periodically review your CRM for duplicates and outdated information.
- Leverage automation: Use automated tools to flag or clean up incorrect or duplicate entries.
These steps will help ensure your CRM remains accurate and efficient as your team scales.